This web page provides documentation and a simple web based
user interface to the universal software defined radio based
receiver and radar data analysis programs running at
the Millstone
Hill UHF incoherent scatter radar. The radar is operated as a
Geospace Facility by the US
National Science Foundation.
The main features of this user interface are:
ion line,
plasma line,
sky noise,
oscilloscope,
bit plot, and
digital rf
plotter. These features are implemented as pull-based cgi scripts
that access both the radar data being acquired and the higher level data
products being derived from the acquired data.
Introduction
The new radar receiver system is based on newly developed data
standards: Digital RF (DRF) and Digital Metadata (DMD). These are
HDF5 based storage formats aimed for efficient storage and fast
random access of raw voltage radar data and arbitrary data
products with an inherent temporal dimension. This data is time
stamped accurately with a concept of samples since epoch, which
allows data with various different sample rates to be naturally
aligned. These data formats are already used at various
observatories and universities for geophysical
instrumentation. The specifications
for
DRF
and
DMD are available.
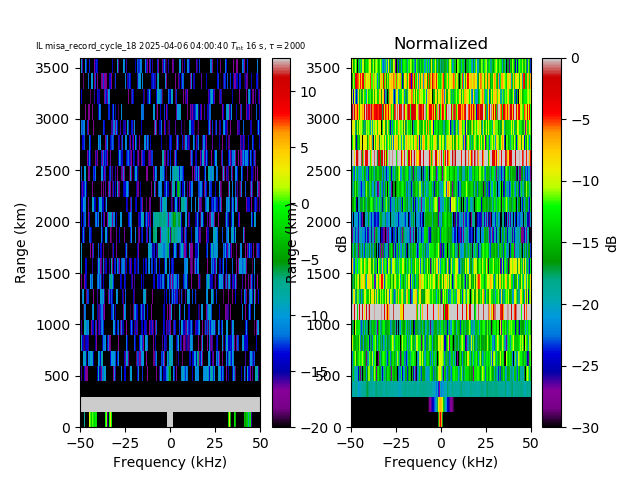
Ion Line
The latest ion line portion of the incoherent scatter radar spectrum.
An ion line overview plot is generated using the wide band 25
MHz data in the same way as the plasma line data, by multiplying
a range delayed and conjugated transmit pulse with the radar
echo. For \(N\) transmit pulses at a time interval of \(\tau\),
we form an average with: $$ S_{r,\omega, m} = \frac{1}{N}
\sum_{n=0}^{N-1} |\mathcal{F}_D\{ \epsilon^*_{n \tau + m\tau N +
t-r} m_t + \xi_{n\tau + m\tau N + t}\}|^2, $$ where
\(\epsilon_t\) is the transmit waveform multiplied with a window
function, \(m_t\) is the measured radar echo, and \(\xi_t\) is
the receiver noise. In addition to the average range-Doppler
profile, we also calculate the sample variance estimate
\(\hat{\sigma}^2_{r,\omega,m} = \mathrm{Var}( S_{r,\omega, m})\)
using the Welford 5 online estimation
method. The quantities \(\hat{\sigma}^2_{r,\omega,m}\) and
\(S_{r,\omega,m}\) are averaged over one second to provide
sufficient statistics, but to not smear time transient
interference too much.
Finally, these 1 second intervals are averaged using sample
variance weighting and aligned to either one minute or the
length of the measurement cycle. $$ S_{r,\omega} =
\frac{1}{\sum_{m=0}^{M-1} \hat{\sigma}^{-2}_{r,\omega,m}}
\sum_{m=0}^{M-1} \frac{1}{\hat{\sigma}^2_{r,\omega,m}}
S_{r,\omega,m}, $$ where \(M\) is a sufficient number of
individual spectra to cover the measurement interval. Currently,
\(M\) is set to cover either a minute or a full integration
period.
The data is processed using a matched filter and a
filterbank of transmit pulses matched in range and Doppler,
which are incoherently averaged. No other attempt to deconvolve
the true incoherent scatter spectrum is made.
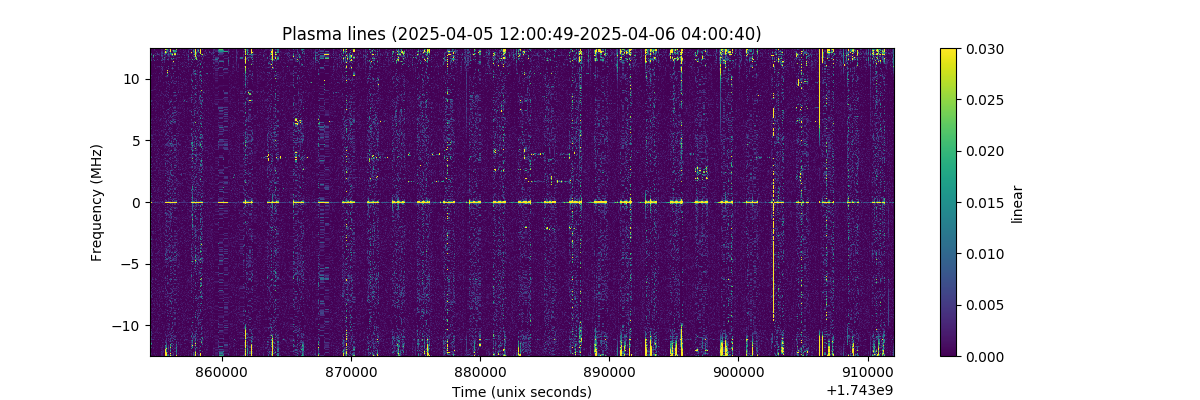
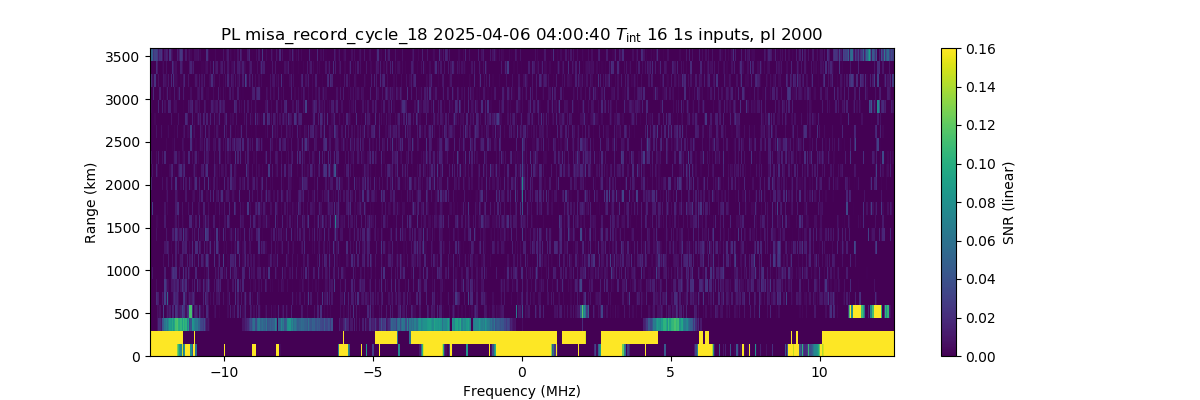
Plasma lines
Latest 24 hours of plasma lines. Maximum plasma line power over altitude range 180 to 350 km is reported.Latest plasma line profile with 1 minute integration period.
The novel feature of this new receiver is the ability to
observe radar echoes in a wide 25 MHz bandwidth of range-Doppler
spectrum, including superthermal electron enhanced plasma
lines 2. Observations of this type
have been occasionally made at Millstone Hill in the past
3 but this architecture allows plasma lines to
be acquired whenever the radar is active and geophysical conditions
are favorable. The 25 MHz bandwidth of the current receiver system captures the full
geophysical remote sensing information available from large aperture high power
(megawatt-hectare class) incoherent scatter radars such as Millstone Hill.
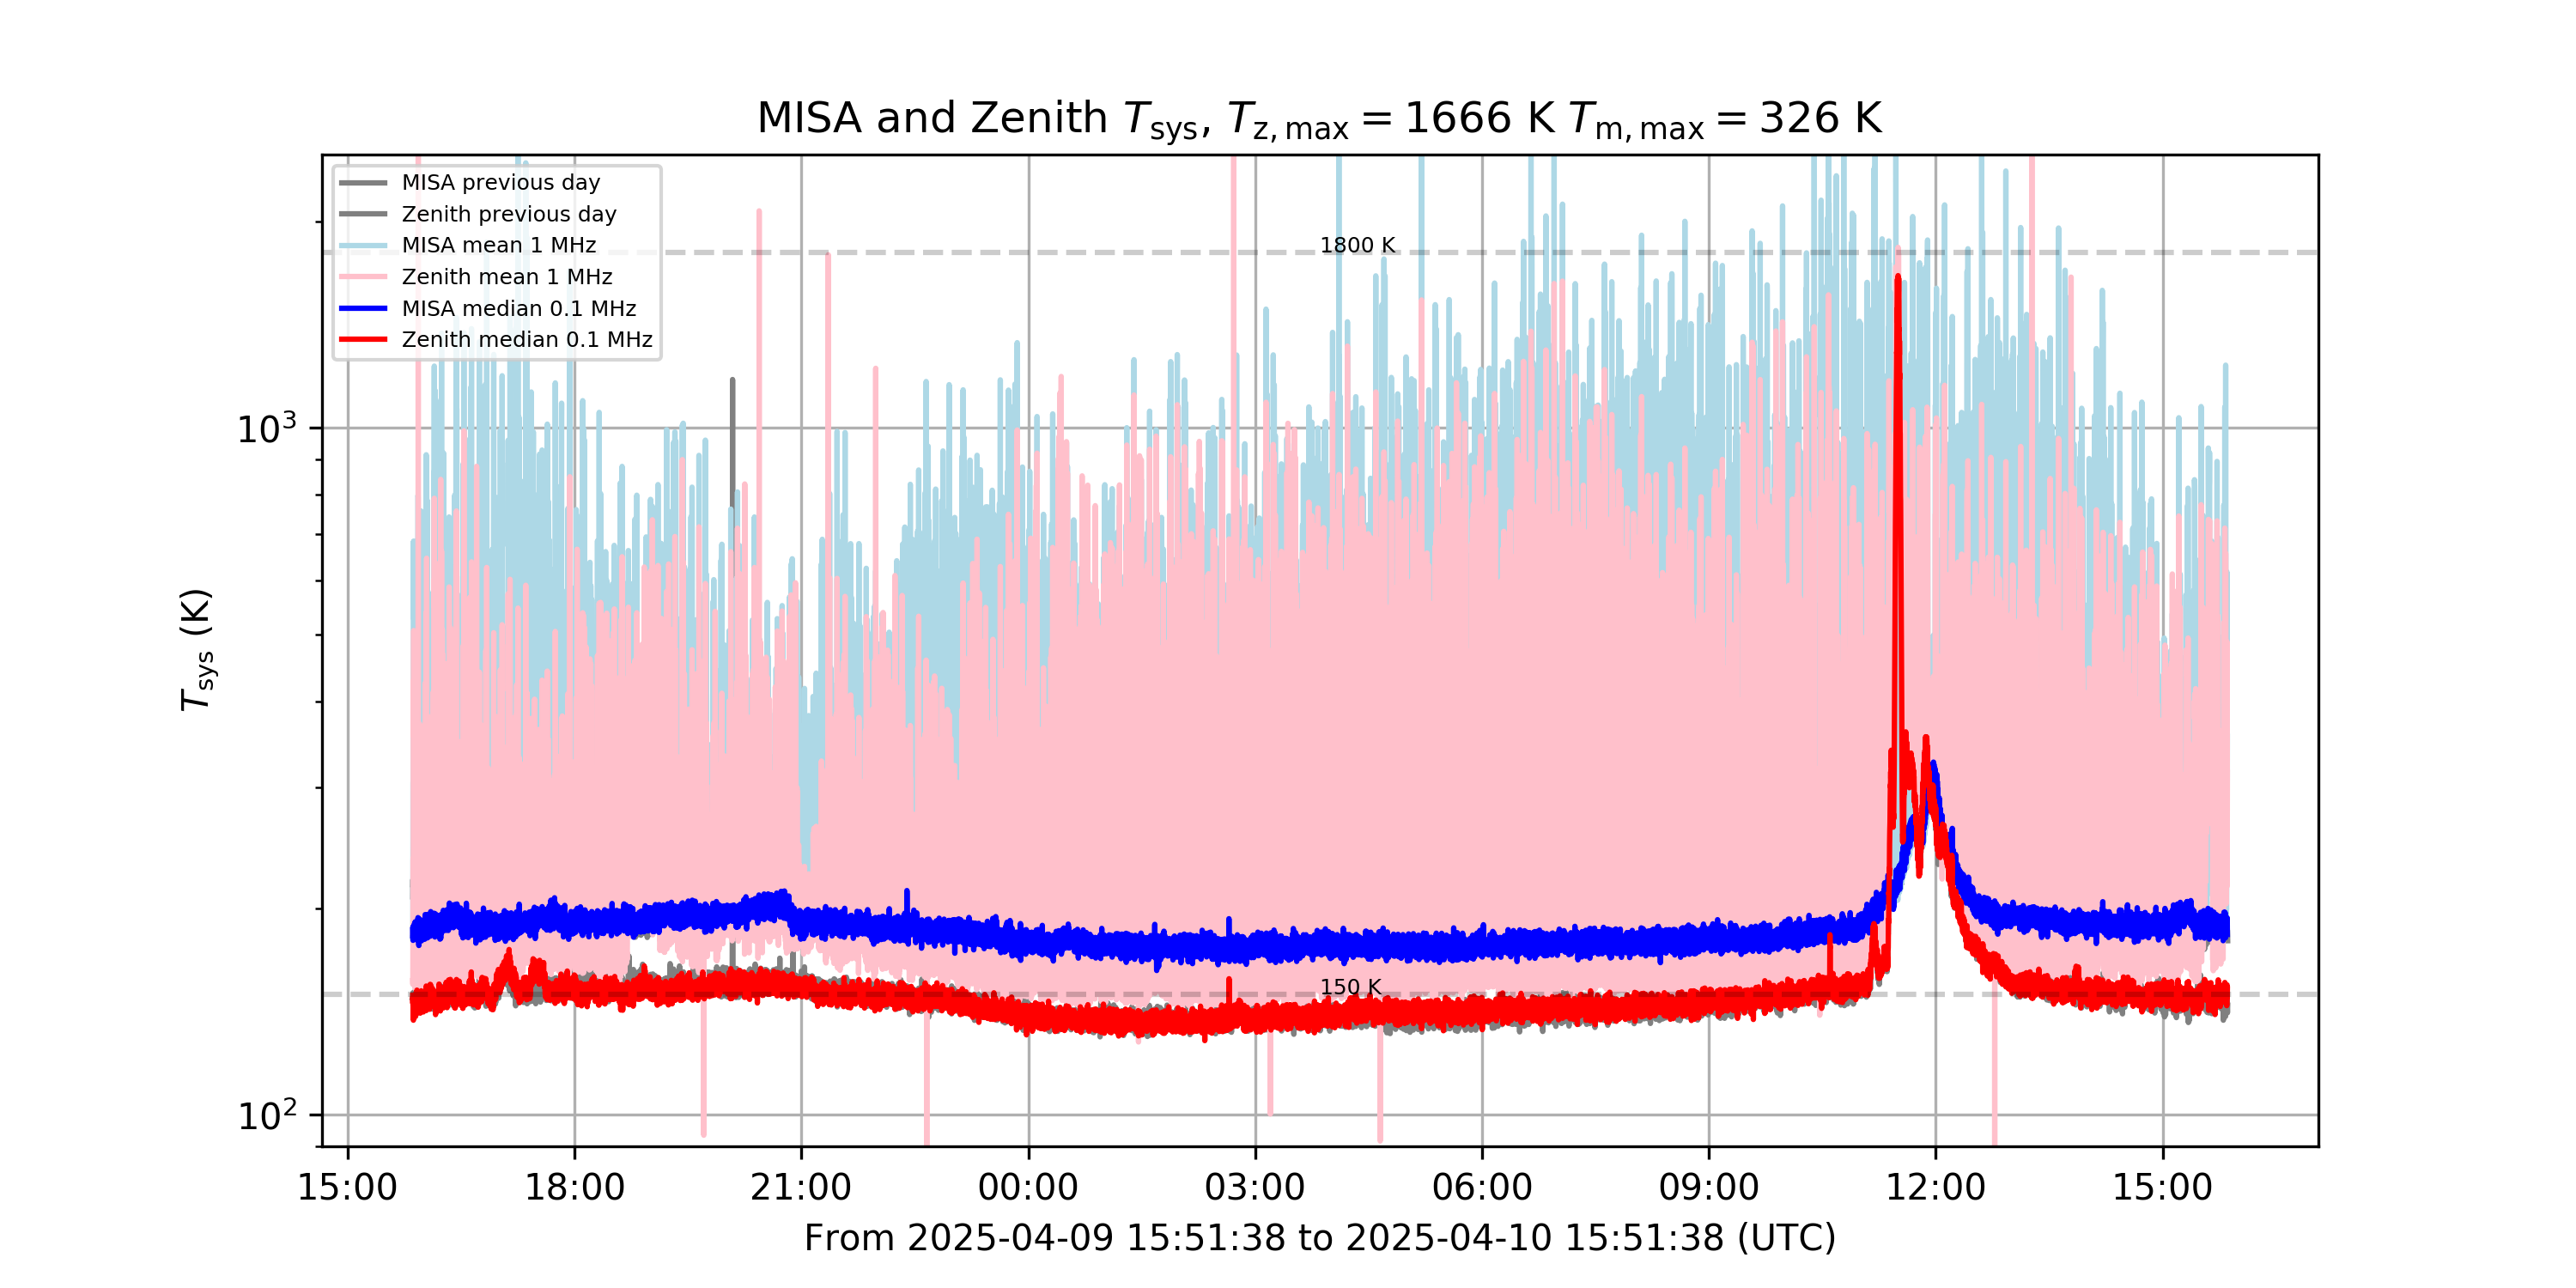
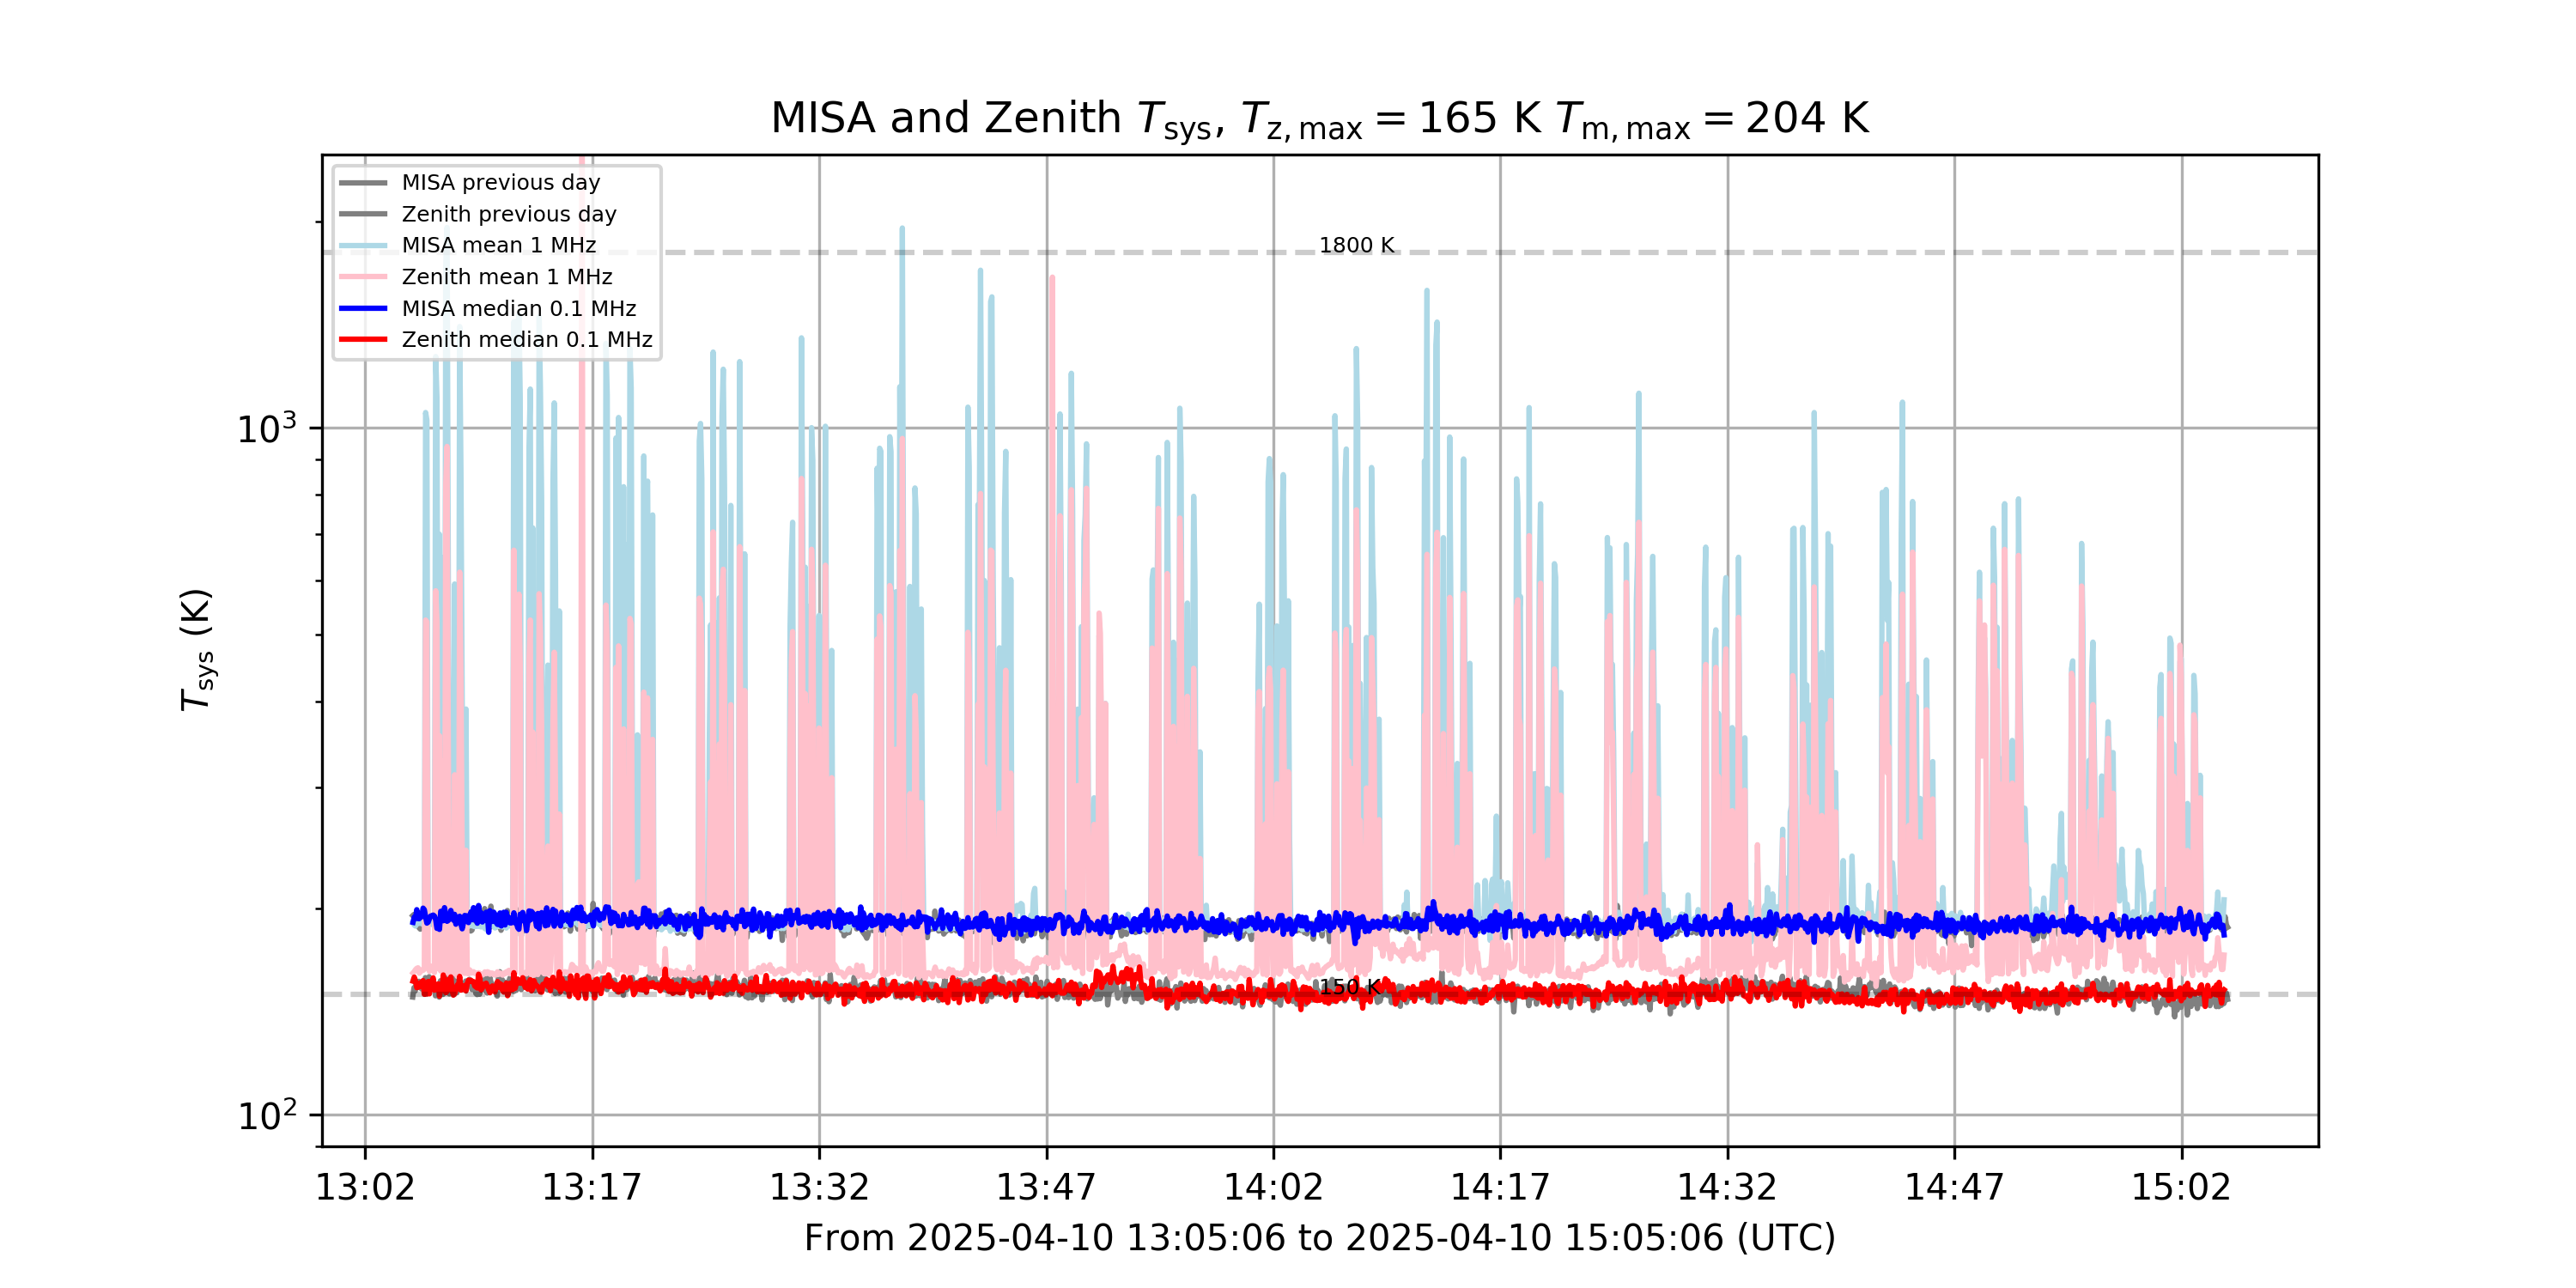
Receiver Noise
Latest 24 hours of receiver noise.Latest two hours of receiver noise.
The receiver noise of the radar is measured using a noise
injection system triggered at the end of each radar inter-pulse
period. The effective temperature of the receiver noise
injection diode is calibrated at occasional intervals using a
NIST traceable noise injection diode, an ambient temperature hot
load, and a liquid nitrogen cooled load. The latest values of
the noise injection diodes from August 2015 are:
\(T_{\mathrm{zenith,inj}} = 1689 \pm 4\) K, and
\(T_{\mathrm{misa,inj}} = 1601 \pm 3\) K, with a calibration
documented in ISR memo
001.
Due to the large amount of radio interference in UHF bands at
Haystack, we estimate receiver noise using two independent
methods: mean power over a 1 MHz band, and median power over a
0.1 MHz band. These data products are calculated for a 5 second
interval and recorded as digital metadata in
the rx_noise_temperature channel. The mean
estimator has smaller variance due to a larger number of samples
going into the estimate, but is susceptible to power line
interference appearing e.g. as impulsive power spikes in the
receiver. In the plots above, the mean estimator is shown using
a light color and the median estimator is shown with a darker
color. The plot is also a good indicator of the severe effects
induced by strong power line interference. The more divergence
in the mean and median estimates, the more interference the
receiver is experiencing.
The receiver noise can also be used to determine the gain of
the antennas. A recent survey using strong radio sources Cygnus
A and Cassiopeia A with known flux densities at 440.2
MHz 4,5 showed that the gain of MISA is
\(43.5 \pm 0.5\) dB and Zenith is \(44.5 \pm 0.6\) dB. Zenith
gain has more errors associated with it because the antenna's
pointing direction was set for optimal Cygnus-A transits back in
1962, and therefore it is not completely certain that Cygnus-A
still passes through the center of the beam.
Low bandwidth data
An example oscilloscope plot. The above plot is updated in realtime.
The plot below shows an example time-amplitude plot of
complex baseband data with transmit pulse, ground clutter, and
receiver noise injection marked up based on metadata collected
by the system, which is transmitted via an amplitude modulated id code.
This plot is useful for diagnosing the state of the radar and
to identify possible problems, such as radio
interference 1. The most common source
of interference
is power
line interference, which is though to be generated by a
faulty insulator in the transformer yard next to the radar. This
faulty insulator causes arcing on dry weather, which is seen as
strong sub microsecond spikes.
Zenith antenna performance
This plot shows the gain and efficiency of the zenith antenna,
going back up to one year. Uses once per day Cygnus pass.
The plot show the performance of the zenith antenna. The most recent data is shown in the title.
Cycle mark monitor
This plot shows how consistent (or not) the cycle times are, and
is a diagnostic of problems with the MIDAS-W software radar controller system.
The plot below shows cycle mark periods for the past 24 hours. A cycle mark
period is defined as the time between the start or end of a radar integration
period and the previous start or end mark.
RF System Interconnection Diagram
A high level plot of the data system configuration is shown in
the figure below. The main source of RF is the MISA and Zenith
receiver taps, which originate from the grey wall panel at the
GSC. Other important signals are transmit waveform from the
combined MISA and Zenith transmitter waveguide taps, the TTL level
receiver protection signal (TR), and the identification code for
each pulse (ID), which is an amplitude modulated 10 MHz
carrier.
Wiring diagram for the digital rf data system.
Software System Diagram
The system is implemented in Python, C, and C++. Most of the
code is in fact Python, with only the performance intensive
portions written in very C-like C++ or pure C.
Different data streams, their dependency tree, and associated services producing these data streams..
Digital Receiver System Usage
The system is divided into minimal services, which run
indefinitely in the background with nohup with the midasop user
account permissions. All of the production services are in
directory ~/mho_production. All data is also owned by
midasop. Service specific log files are located in
directory ~/mho_production/log. These logs are rotated, so the previous three log files survive restart, and can be used to determine causes for potential failures.
The services can be
restarted with the start_all.sh script. The services
are shutdown with the stop_all.sh script. The scripts
are designed to be relatively tolerant of various failure modes
and to recover from them. This is mainly achieved by having each
service implement a very minimal set of functionality.
Rogers, A. E. E., "Interference temperature from model for power line noise". RFI MEMO 014, MIT Haystack Observarory, 2005.
Perkins, Francis, and E. E. Salpeter. "Enhancement of plasma density fluctuations by nonthermal electrons". Physical Review 139.1A, 1965.
Cicerone, R.J. and Bowhill, S.A., 1971. "Photoelectron fluxes measured at Millstone Hill". ,Radio Science, 6(11), pp.957-966.
Baars, J. W. M., et al. "The absolute spectrum of CAS A-an accurate flux density scale and a set of secondary calibrators." Astronomy and Astrophysics 61 (1977): 99-106.
Heeschen, D. S., and B. L. Meredith. "Secular variation of the flux density of the radio source Cassiopeia A." (1961): 705-706.
Welford, B. P.. “Note on a Method for Calculating Corrected Sums of Squares and Products”. Technometrics 4.3 (1962): 419–420